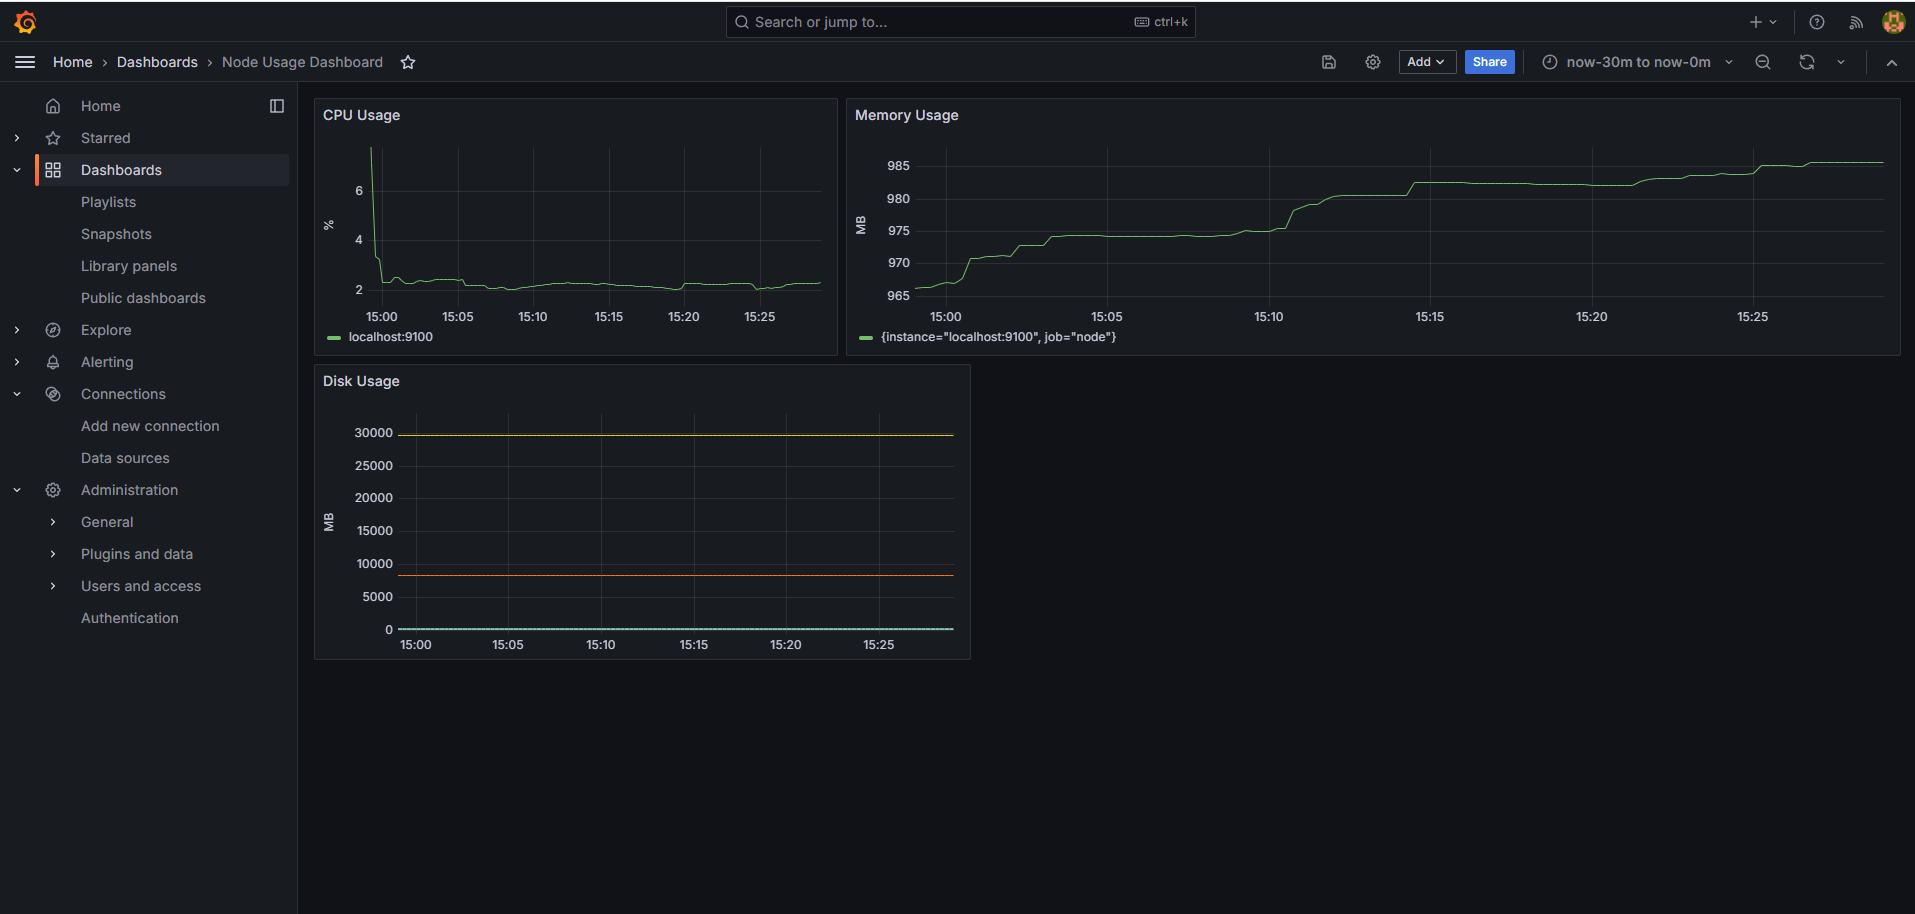
[개선] Prometheus & Grafana 로 CPU & Memeory 모니터링
ChatGPT 요약
Prometheus와 Grafana를 이용해 블로그를 모니터링하려고 합니다.
- Prometheus: 데이터 수집과 저장에 중점을 둡니다.
- Grafana: 수집된 데이터를 시각화하는 도구로 사용됩니다.
| 항목 | Prometheus | Grafana |
| 주요 역할 | 데이터 수집 및 저장, 알림 설정 | 데이터 시각화 및 대시보드 생성 |
| 데이터 처리 방식 | 시간에 따른 시계열 데이터 수집 | 다양한 소스의 데이터를 그래프로 시각화 |
| 알림 기능 | 내장된 Alertmanager를 통해 경고 메시지 전송 | 특정 조건에서 사용자에게 알림 전송 |
| 사용자 인터페이스 | CLI 및 API 중심, 웹 UI 제공 | 직관적인 웹 UI 기반 대시보드 |
| 데이터 소스 | Prometheus 전용 메트릭 수집 | Prometheus를 포함한 다양한 데이터 소스 지원 |
예로, Prometheus는 CCTV 카메라와 같고, Grafana는 모니터링 화면이라고 생각할 수 있습니다. Prometheus는 서버, 애플리케이션 등의 상태나 성능 지표를 끊임없이 수집하고 저장하는데, 이는 CCTV 카메라가 실시간으로 영상을 기록하는 것과 비슷합니다. Grafana는 이러한 기록된 데이터를 기반으로 사용자가 이해하기 쉽게 그래프, 차트 등의 형식으로 화면에 보여주는데, 이는 CCTV 영상을 모니터 화면에 실시간으로 표시하는 것과 유사합니다.
Prometheus 설치
https://prometheus.io/download/ 링크에 들어가 필요한 버전을 확인합니다.
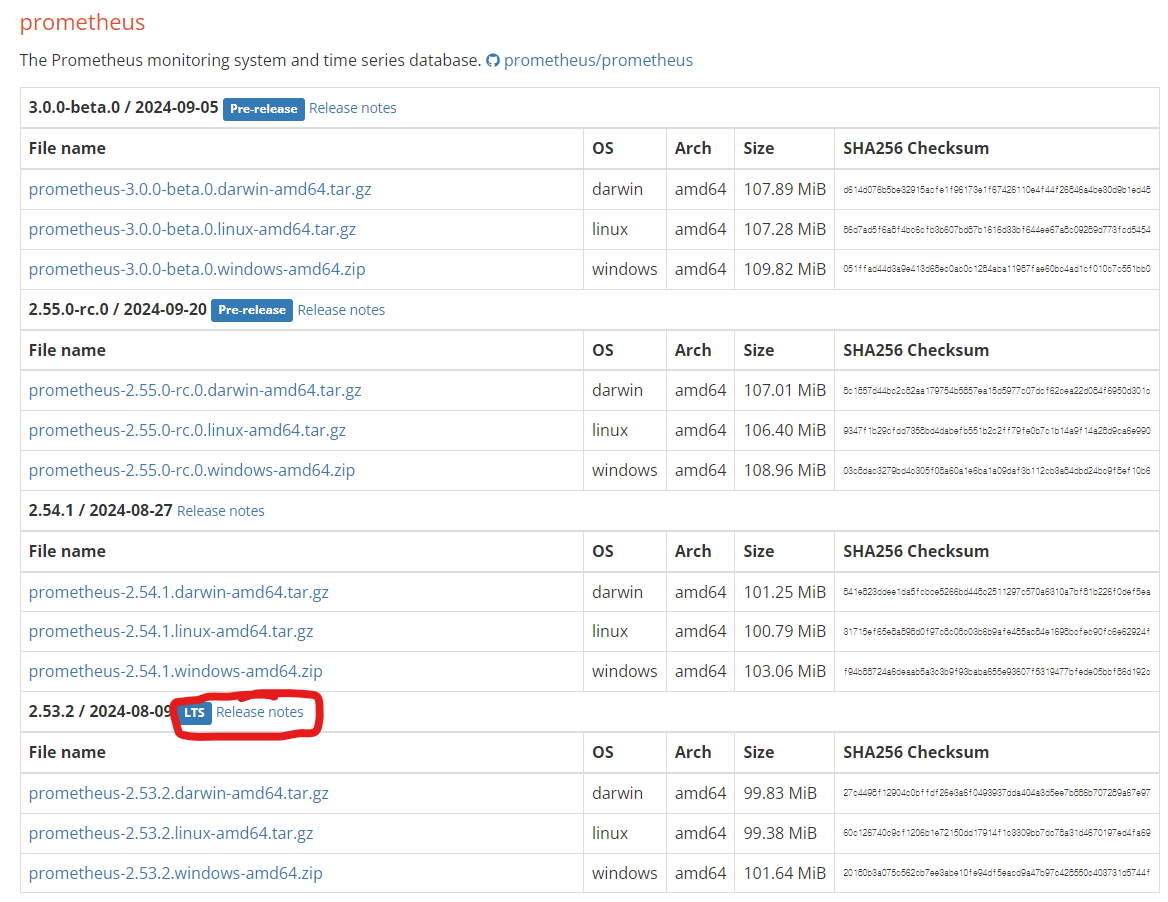
LTS(장기 지원 버전) 인 것을 다운로드 하려고 합니다.
저의 서버는 라즈베리파이를 이용하고 있기 때문에 armv7 를 제공하는 것으로 설치해야합니다.
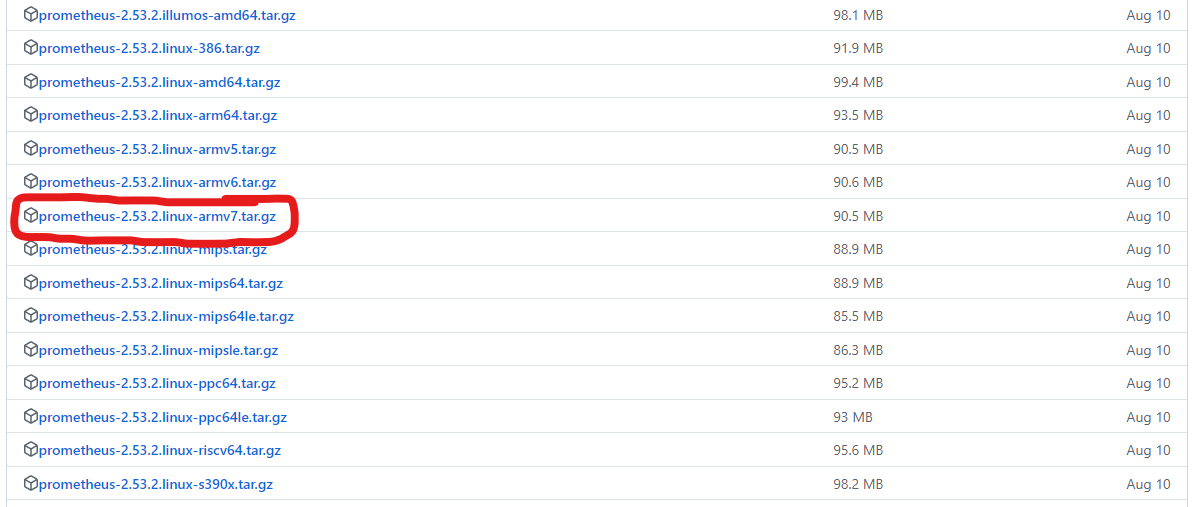
https://prometheus.io/docs/prometheus/latest/getting_started/ 에 나와있는 예제 대로 명령을 작성해 봅시다.
# 다운로드 받을 위치 이동
cd ~/

# 다운로드 받을 파일
wget https://github.com/prometheus/prometheus/releases/download/v2.53.2/prometheus-2.53.2.linux-armv7.tar.gz

# 압축 파일 풀기
tar -xvzf prometheus-*.tar.gz

# 다운로드 받은 압축 파일 제거
rm -rf prometheus-*.tar.gz

# 폴더 들어가기
cd prometheus-*

# prometheus 실행
./prometheus --config.file=prometheus.yml

실행을 하니 주소:9090 으로 잘 접속이 됐습니다.
Node Exporter 설치
Node Exporter 는 하드웨어의 상태와 커널 관련 메트릭을 수집하는 메트릭 수집기입니다
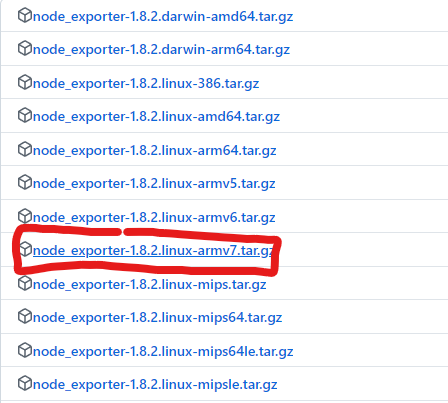
이제 Prometheus 에서 서버의 CPU 랑 Memory 사용량을 확인하기 위해 Node Exporter 를 설치합시다.
https://prometheus.io/download/#node_exporter

# 다운로드 받을 폴더 접근
cd ~/

# Node Exporter 다운로드
wget https://github.com/prometheus/node_exporter/releases/download/v1.8.2/node_exporter-1.8.2.linux-armv7.tar.gz

# 압축 해제
tar -xzf node_exporter-1.8.2.linux-armv7.tar.gz

# 압축 파일 제거
rm -rf node_exporter-1.8.2.linux-armv7.tar.gz

# 폴더 접근
cd node_exporter-1.8.2.linux-armv7

# Node Exporter 실행
./node_exporter
Node Exporter는 기본적으로 9100 포트에서 메트릭을 제공하므로, Prometheus 설정 파일에서 이를 설정해야 합니다.
vi ~/prometheus-2.53.2.linux-armv7/prometheus.yml
아래와 같이 scrape_configs 를 수정합니다.
scrape_configs:
  - job_name: 'node'
    static_configs:
      - targets: ['localhost:9100']
이제 다시 Prometheus 를 실행합니다.
# 폴더 들어가기
cd ~/prometheus-*

# prometheus 실행
./prometheus --config.file=prometheus.yml
문제 없이 작동 시키기 위해서는 Node Exporter 랑 Prometheus 를 계속 백그라운드에서 실행을 유지해야 합니다. 이를 대신해 systemd 서비스를 설정하여, 서버가 재부팅되더라도 자동으로 실행되도록 작업하겠습니다.
먼저, 다운로드한 파일을 압축 해제한 후, 해당 폴더를 /opt 경로로 이동시킵니다.
mv ~/prometheus-2.53.2.linux-armv7/ /opt/
mv ~/node_exporter-1.8.2.linux-armv7/ /opt/
systemd 서비스 설정
sudo vi /etc/systemd/system/prometheus.service
[Unit]
Description=Prometheus Service
After=network.target

[Service]
ExecStart=/opt/prometheus-2.53.2.linux-armv7/prometheus --config.file=/opt/prometheus-2.53.2.linux-armv7/prometheus.yml
Restart=always
User=root

[Install]
WantedBy=multi-user.target
sudo vi /etc/systemd/system/node_exporter.service
[Unit]
Description=Node Exporter
After=network.target

[Service]
ExecStart=/opt/node_exporter-1.8.2.linux-armv7/node_exporter
Restart=always
User=root

[Install]
WantedBy=multi-user.target
# 서비스 다시 로드
sudo systemctl daemon-reload

# Prometheus 서비스 시작 및 활성화
sudo systemctl start prometheus
sudo systemctl enable prometheus

# Node Exporter 서비스 시작 및 활성화
sudo systemctl start node_exporter
sudo systemctl enable node_exporter
# Prometheus 서비스 확인
sudo systemctl status prometheus

# Node Exporter 서비스 확인
sudo systemctl status node_exporter
Grafana 설치
Grafana 를 우선 설치해 보겠습니다.
https://grafana.com/tutorials/install-grafana-on-raspberry-pi/
sudo mkdir -p /etc/apt/keyrings/
wget -q -O - https://apt.grafana.com/gpg.key | gpg --dearmor | sudo tee /etc/apt/keyrings/grafana.gpg > /dev/null

echo "deb [signed-by=/etc/apt/keyrings/grafana.gpg] https://apt.grafana.com stable main" | sudo tee /etc/apt/sources.list.d/grafana.list

sudo apt-get update
sudo apt-get install -y grafana
sudo apt-get install -y grafana 명령어를 실행한 후 서버가 재부팅되었습니다.
당시 저는 외부에 있었고, 서버가 자동으로 잘 켜질 줄 알았습니다.
하지만 이상하게도 서버가 실행되지 않았던 것 입니다.
집에 들어와서 왜 그랬는지 살펴보는데 이슈를 알게 되었습니다.
저희 집 네트워크는 [모뎀 -> 공유기] [모뎀 -> 서버] [모뎀 -> 컴퓨터] 이런 식으로 사용하고 있는데, 모뎀에서 네트워크를 직접 사용하는 기기들 ([모뎀 -> 서버], [모뎀 -> 컴퓨터]) 은 재부팅 시 [모뎀 -> 공유기] 를 사용하고 있으면 네트워크가 작동하지 않는 이상한 이슈가 발생했습니다.
그래서 외부에서 서버가 재실행되지 않아 곤란한 상황을 겪었습니다.
이런 상황을 극복하고 다시 작업을 시작했습니다.
sudo /bin/systemctl enable grafana-server
sudo /bin/systemctl start grafana-server
이제 grafana 에 접근이 가능합니다!

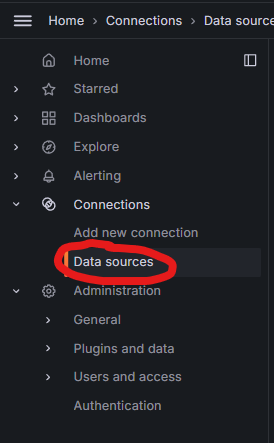
접속 완료 후, Data sources 에 접근합니다.
Connection 부분에 host 를 지정합니다.
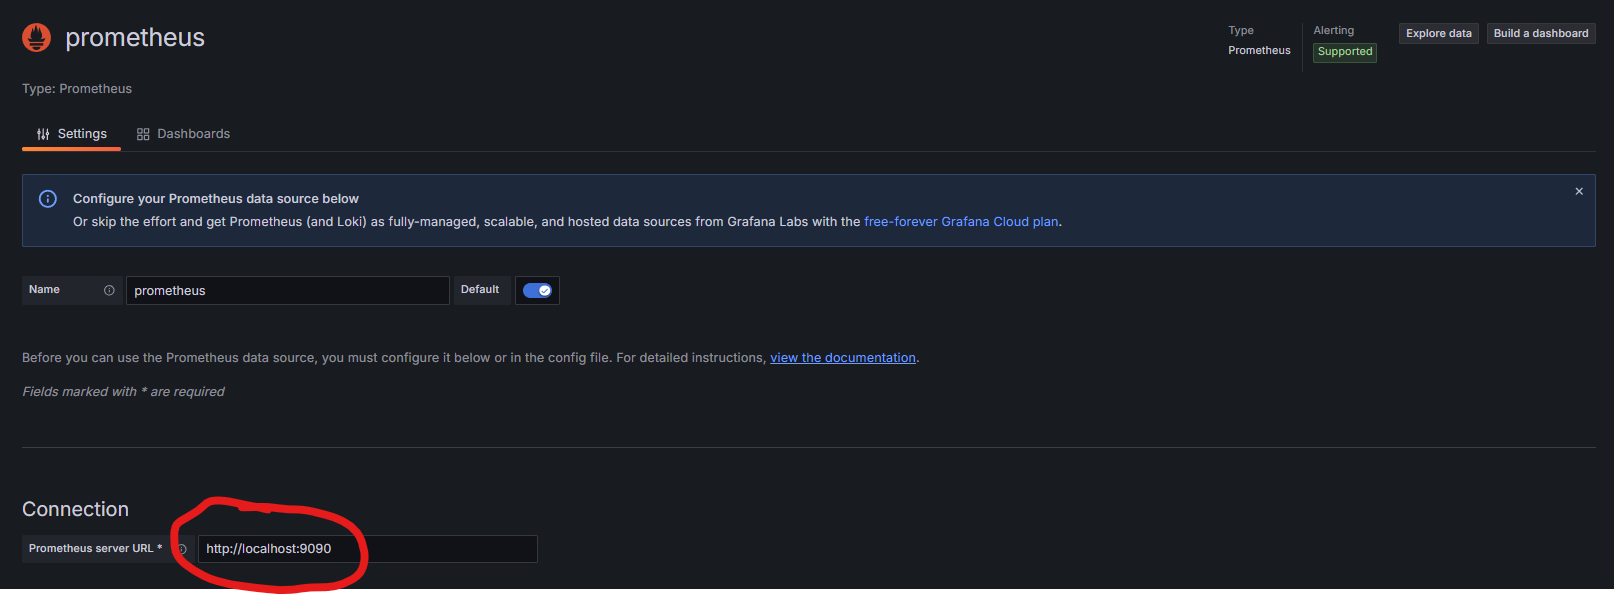
마지막에 Save & Test 버튼을 클릭합니다.

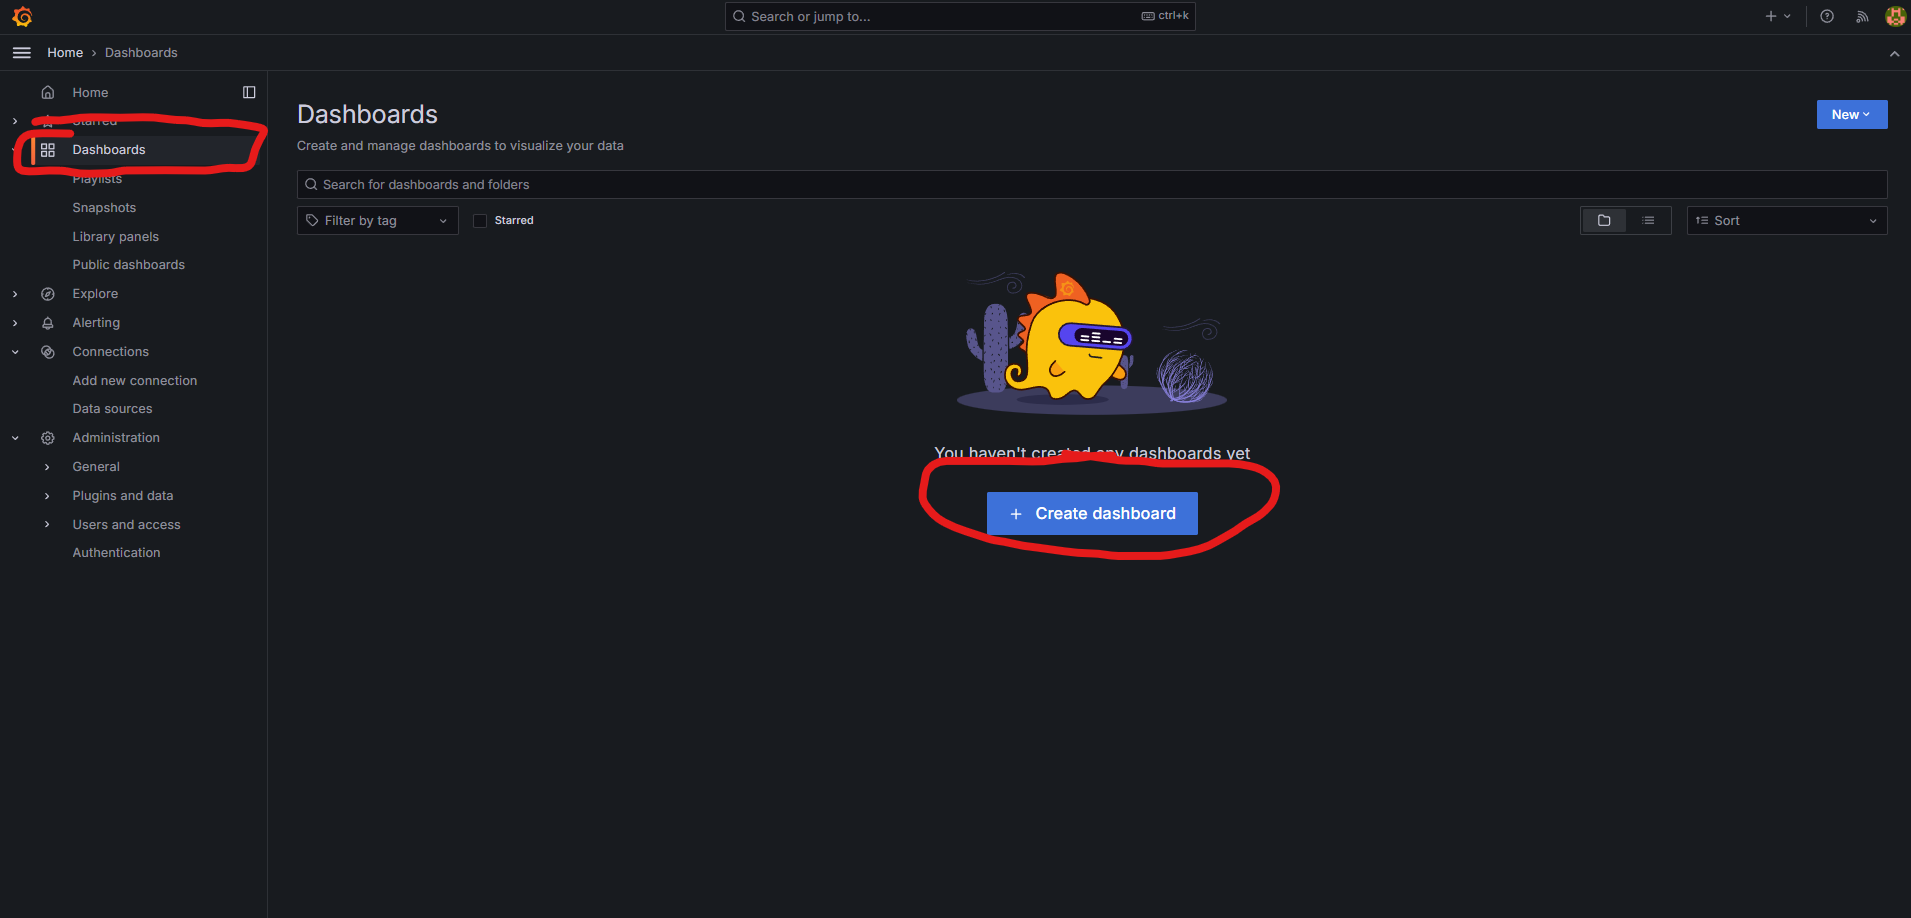
이제 본격적으로 Dashboard 를 만들어 봅시다.
Dashboard 영역에 들어가 Create dashboard 버튼을 클릭합니다.
Add visualization 을 클릭합니다.
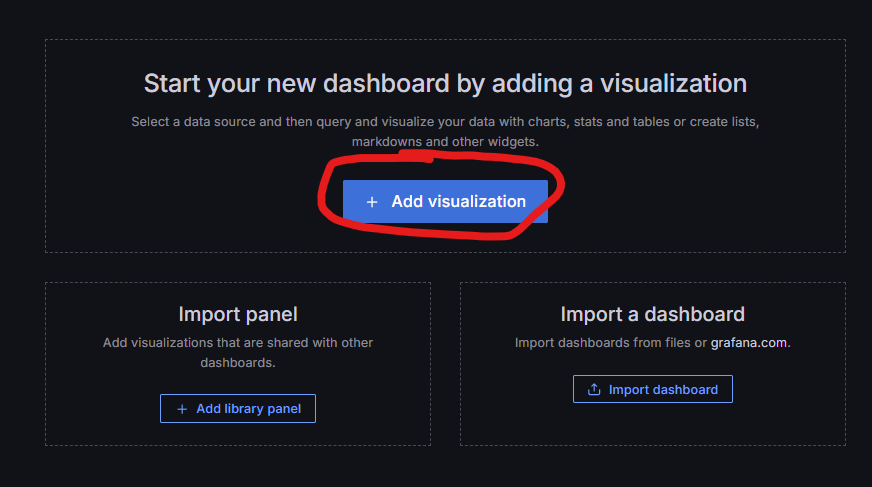
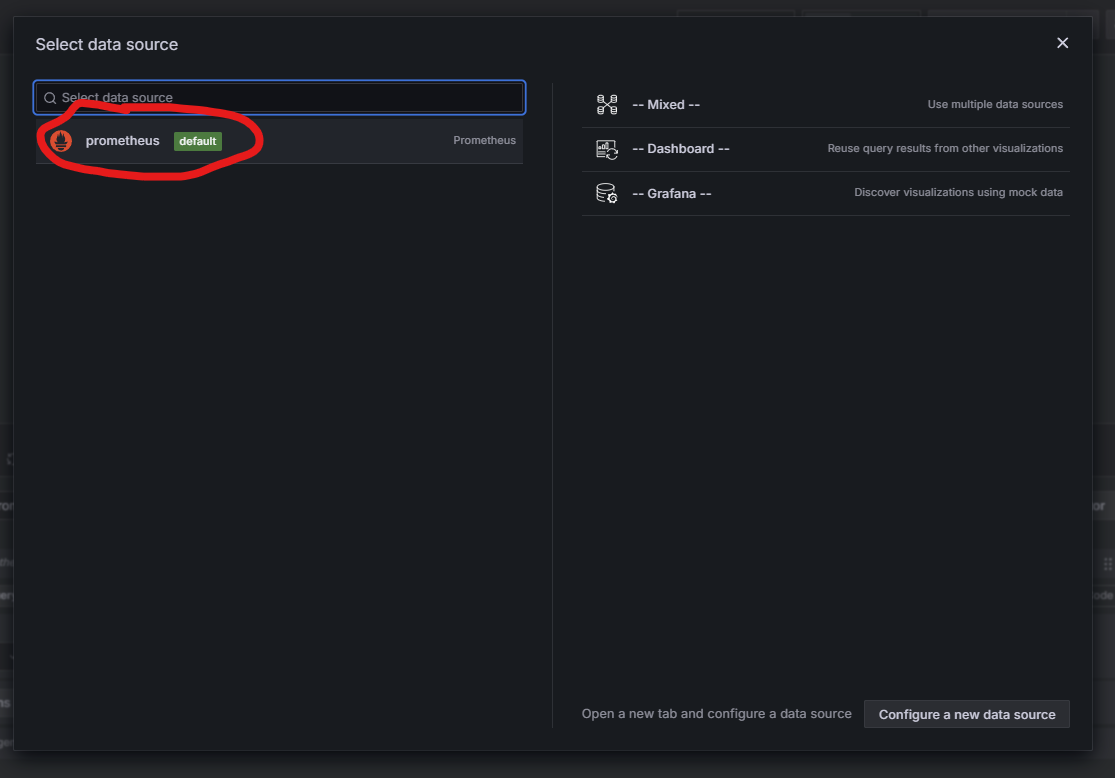
prometheus 를 선택합니다.
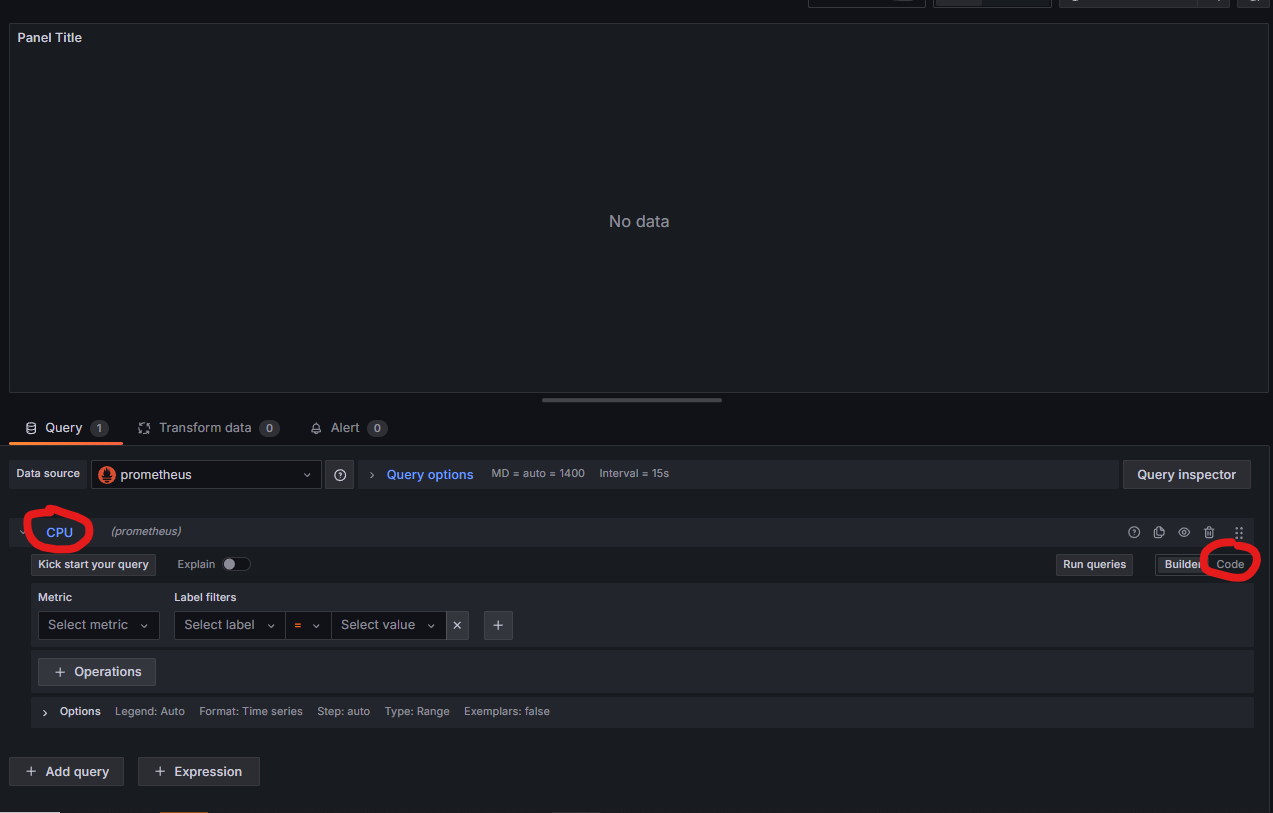
이름을 바꿔주고 Code 를 클릭합니다.
CPU 사용량 쿼리:
100 - (avg by (instance) (rate(node_cpu_seconds_total{mode="idle"}[5m])) * 100)
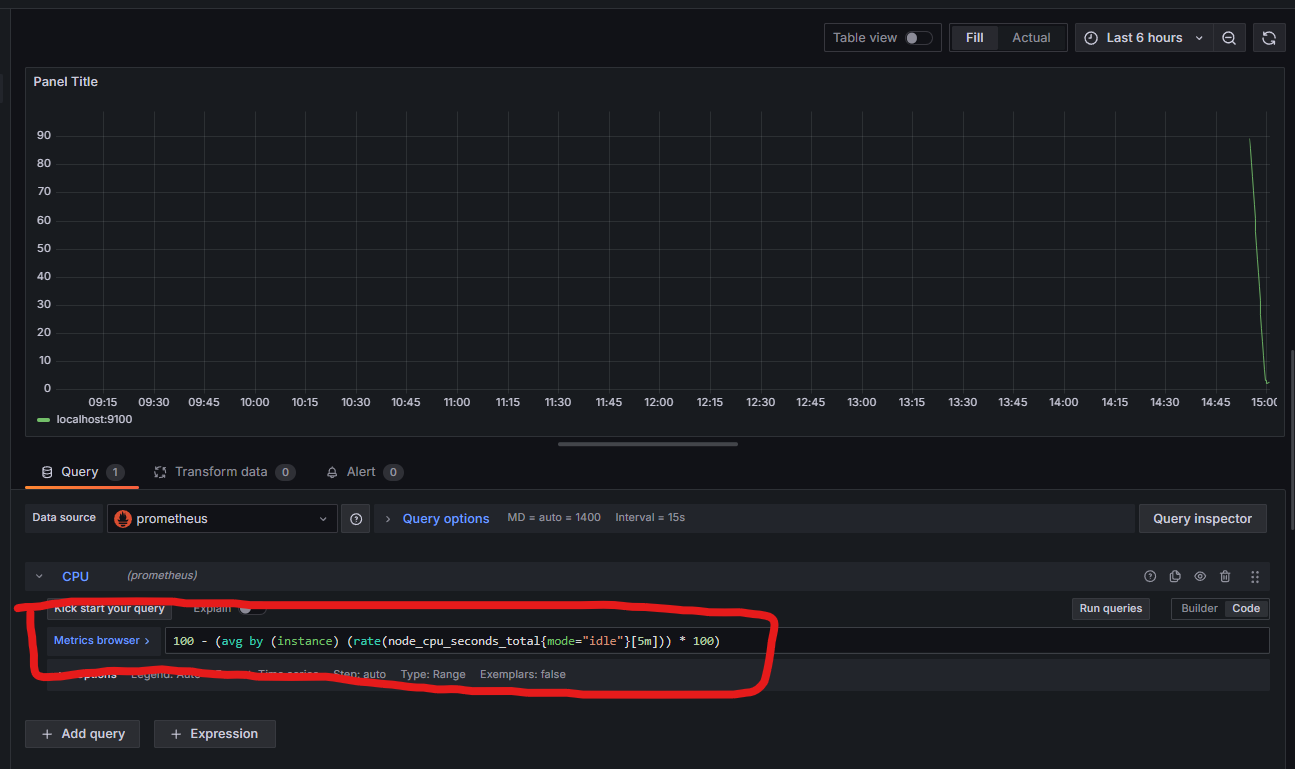
이렇게 하고 Run querys 를 클릭하면 잘 작동합니다!!
그럼 이제 메모리 사용량 또한 Dashbaord 를 만듭니다.
메모리 사용량 쿼리:
(node_memory_MemTotal_bytes - node_memory_MemAvailable_bytes) / 1024 / 1024
완료했습니다~ 기타 등등 설정을 만져서 조금 수정해서 Dashboard 를 저장했습니다~
